What is Autochartist FX indicator with 80% accuracy?


Notice
This Post has ended its release period. Please check HotForex's latest information and campaign on HotForex's company introduction page.
HotForex - What's now?
We are no longer promoting HotForex. The information regarding to HotForex on the website 'Hercules.Finance' maybe outdated. ref. HotForex
- How does Autochartist work?
- How Accurate is Autochartist?
- Trading Tools of Autochartist
- How to start using Autochartist?
- Key features of Autochartist
- Why you should use Autochartist?

Get free access to Autochartist
How does Autochartist work?
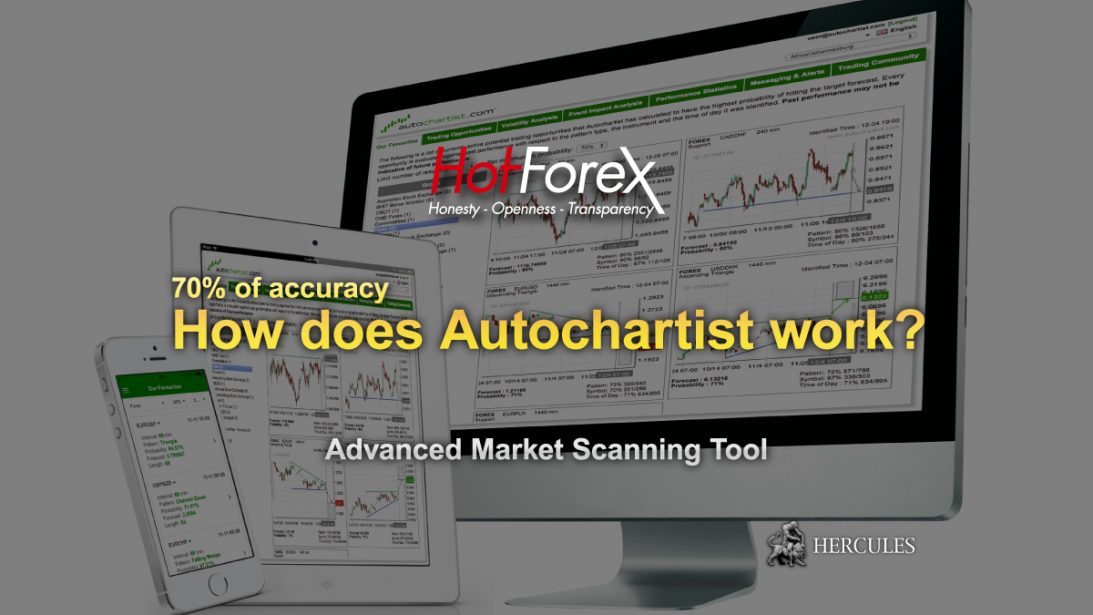
Autochartist tool scans hundreds of charts to identify predefined patterns as they form.
Once the pattern is identified you are alerted and can enter or exit a trade quickly.
The tool is ideal for both beginners and advanced traders and will save you the time and effort it takes to identify patterns.
Available on Forex, Commodities and CFDs in 14 languages including English, French, Hungarian, Indonesian, Russian, Arabic and others.
How Accurate is Autochartist?
With 70% accuracy rate of forecasts of price breakout, Autochartist is considered one of the world’s most advance intraday tools for automatic identification of Chart and Fibonacci patterns.
Patterns identified by Autochartist include:
- Butterfly
- Gartley
- Channel Down
- Ascending Triangle

Signup for HotForex and Get Autochartist
Trading Tools of Autochartist
There are number of trading tools you can utilize with Autochartist.
With HotForex, all the tools of Autochartist are free to use.
1. Chart Patterns
- Receive audio and visual alerts when emerging and completed patterns are identified.
- Benefit from the automatic Forecast Zone plotted on completed Chart Patterns.
- Use Performance Statistics to view success rates of patterns reaching the forecast zone.
2. Key Levels
- Horizontal support or resistance is often encountered at significant price levels.
- With Key Levels Autochartist automatically identifies these price levels as either “Breakout” or “Approach”.
3. Fibonacci Patterns
- Receive audio and visual alerts of emerging and completed Fibonacci patterns.
- Receive a visual illustration of support and resistance levels according to the theory of the Golden Ratio.
4. Powerstats – Volatility Analysis
Provides traders with insight into relevant movement of instruments, like:
- Average PIP movement in specific timeframes
- Maximum expected price movements across various timeframes
- Expected price movements over weekly and daily timeframes
Visit HotForex Official Website for more
How to start using Autochartist?
To use Autochartist tool, first you need to install and launch Autochartist from MT4.
Then receive real-time alerts of profitable trade opportunities through a web and custom indicators.
To start with, there are 2 important features available on Autochartist.
1. Performance Statistics
To access this feature in your web application, sign on, click on the “Performance Statistics” Tab.
You will notice that there are three columns of statistics broken down by Exchange or Instrument type.
You can click on any of the buttons to draw a report that is specific to that Exchange or type of Instrument, and for a particular analysis type.
2. Market Coverage
To access this feature sign on to the Autochartist web application, click on the Education and Resources Tab, click on the Market Coverage link under the Reference section.
Select an Exchange on the left to see the available Symbol list, along with the candle intervals on which this instrument is monitored.
Whatever your trading style, Autochartist’s range of tools enables you to support your research and trading decisions with a user-friendly technical analysis package.
As well as scanning the markets, Autochartist identifies technical chart-pattern formations such as triangles, wedges, tops and bottoms.
Get Autochartist on HotForex MT4
Key features of Autochartist
- Scans the markets and identifies chart-pattern formations
- Provides you with reports in real time
- Analyses market data across multiple time-frames
- Identifies past trends and indicates general price movement
- Free for all Live account clients
Autochartist helps you monitor trends and patterns
Trends and patterns take time to identify and monitor “manually”.
Autochartist provides chart-pattern alerts automatically, in real time, every 15 minutes or at intervals you choose.
All reports are displayed in a simple format for easy identification of both emerging and completed patterns, helping you capitalise on opportunities and trade with more confidence.
You can easily personalise the reports
You can personalize the Autochartist interface by selecting just the pre-defined time-frames and instruments required.
On top of that, you can add more indicators as you gain experience and confidence.
You’ll get analysis on multiple timeframes
Autochartist analyses market data across multiple time-frames.
As a price changes, the most recent chart patterns are updated and you continue to receive alerts as a pattern develops.
The quality of each pattern alert is clearly displayed and supported with indicators showing the initial trend, clarity and uniformity of the pattern.
Autochartist helps you identify past trends
Autochartist identifies both the support and resistance levels that influence emerging and complete patterns with indications of the general direction of price movement as well as past trends.
The pattern types support both trend and swing trading.
Emerging patterns help swing traders capitalise on the movements between support and resistance levels, while complete patterns help trend traders to time trades post-breakout.
You can get live scans and patterns throughout the day
Whether trading part-time or full-time, you will benefit from the availability of live scans and pattern alerts through the day, for as long as the market is open.
Autochartist is available free of charge for all Live clients.
If you have a Demo account, you can sign up for a 14-day trial.
Why you should use Autochartist?
As Autochartist is provided for free by HotForex, you wouldn’t miss the opportunity to now use the tool.
There are many reasons you should use Autochartist to analyze the market.
- Intraday Scanning
Autochartist gives traders early notification of potential trade opportunities throughout the day. - Relevant Trade Opportunity Alert
Autochartist delivers both audio and visual alerts, highlighting only trade opportunities that are actionable and visible to users. - Forecast Zones
On completed patterns, Autochartist automatically plots a forecast zone of what price level is expected to be reached. Autochartist has a 70% success rate in price reaching forecast zones. - Quality Indicators
Each pattern comes with an automated visual analysis that uses a combination of four unique characteristics in assigning a pattern’s quality score. - Autochartist saves time
Rather than forcing a trader to rely on (or acquire) years of training to recognize trading patterns, and key levels (horizontal support or resistance levels) Autochartist scans through massive quantities of market price data and automatically detects predefined patterns and key levels. - Use only one screen and launch Autochartist from MT4
All trade opportunities are consolidated into one screen. That is: Chart Patterns, Fibonacci Patterns, PowerStats and Key Levels. Traders have an ability to switch the opportunities ON/OFF with the click of a button. - Autochartist Trading Tools on MT4
Traders simply drag and drop one of Autochartist’s custom indicators (Chart patterns; Fibonacci Patterns; Key Levels or PowerStats) onto an MT4 chart to see patterns and price clearly overlaid. - Free Education
The Autochartist service is accompanied by training guides and videos from within the application to empower traders to best utilize chart patterns and technical analysis in their day-to-day trading. - Confirm your trading style
Autochartist automatically plots support and resistance lines, catering to both breakout and swing traders. - Highly Customizable Searches
Users can define custom search criteria that filter out unwanted data, leaving only the pattern information most relevant to their own personal trading style.
Latest Features
Sitemap
Services
Promotions
News
Who is Hercules.Finance?
Hercules.Finance is a financial education website powered by a team of Financial Specialists and IT experts, mainly introduce solutions of Forex, CFD and Commodity Investment, and a number of Payment Services. With more than 30 partnered companies all over the world, Hercules.Finance offers trusted and timely information for Investors and Users of the services. By referring to Hercules.Finance, you can find all latest News/Information, Financial Technical/Fundamental Analysis, Main/Exclusive Bonus Promotions of partnered companies and a number of Educational Materials of Finance. For the list of all partnered companies, please visit here. For more latest information of the website, please visit hercules-finance.com.
Risk Warning
Hercules.Finance is not involved in activities regarded as the solicitation of financial products or services and is not intended for residents of the People's Republic of China (PRC). The services promoted on this website might not be supervised by any financial regulatory bodies or public authorities in charge of the Chinese financial markets
Foreign Exchange and Contracts for Difference ("CFDs") are complex financial products that are traded on margin. Trading Forex & CFDs carries a high level of risk since leverage can work both to your advantage and disadvantage. As a result, Forex & CFDs may not be suitable for all investors because you may lose all your invested capital. You should not risk more than you are prepared to lose. Before deciding to trade, you need to ensure that you understand the risks involved taking into account your investment objectives and level of experience. Past performance of Forex & CFDs is not a reliable indicator of future results. All information on Hercules is only published for general information purposes. We do not present any guarantees for the accuracy and reliability of this information. Please note the spreads displayed in the website are all included extra trading commissions, as it shows the whole commissions charged by each broker. Before you engage in trading foreign exchange, please make yourself acquainted with its specifics and all the risks associated with it. Any action you take upon the information you find on this website is strictly at your own risk and we will not be liable for any losses and/or damages in connection with the use of our website.
Copyright
All content on this website including articles, data, website design and environments(collectively the "Content"), is the property of Hercules.Finance or its partnered companies'. All textual content on Hercules.Finance is copyrighted by us or the original sources and protected under intellectual property law and international copyright laws. All website users may not reproduce, publish, distribute, translate or create a derivative work of the content in whole or in part. Website users are granted only a limited license to access, display, download, print and reproduce reasonable portions of the Content solely for their own use, provided that the Content is not modified and all proprietary notices and source references on the Content are kept intact. Hercules.Finance is a website owned by a team of Financial Specialists and IT experts. The other product names and marks referred to on this website are the trademarks of their respective owners. Hercules.Financeに掲載されるニュースやその他リリースは、関係各社の許可の上で掲載されています。翻訳および転載はお断りします。
2012 - 2024 © Hercules.Finance.


